Electrocardiography
Chapter 247 | Part 6: Disorders of the Cardiovascular System · Part 6 – Cardiovascular Disorders
Detailed clinical reference synthesised from Harrison's Principles of Internal Medicine, 22nd Edition
🔑 Key Clinical Points
- The ECG records depolarization and repolarization electrical activity generated by the working atrial and ventricular myocardium.
- Normal QRS axis ranges from –30° to +100°; left axis deviation is +100°.
- Left ventricular hypertrophy (LVH) voltage criteria: RaVL + SV3 > 20 mm in women and > 28 mm in men.
- Hyperkalemia sequence: T-wave peaking → QRS widening → P-wave diminution → sine-wave pattern → asystole.
- Wellens T wave sign: Deep T-wave inversions in precordial leads (V1–V6) associated with high-grade stenosis of the left anterior descending coronary artery.
- Osborn wave: Distinctive convex elevation of the J point seen in systemic hypothermia.
- Total electrical alternans (P-QRS-T) with sinus tachycardia is a relatively specific sign of pericardial effusion, usually with cardiac tamponade.
- A normal ECG throughout the course of an acute infarct is distinctly uncommon; prolonged chest pain without diagnostic ECG changes should prompt a search for other noncoronary causes.
📑 Table of Contents
- 1. DEFINITION & OVERVIEW
- 1.1 BASIC ECG WAVEFORMS AND INTERVALS
- 1.2 ECG LEADS AND GRID
- 2. EPIDEMIOLOGY
- 3. ETIOLOGY & PATHOPHYSIOLOGY
- 3.1 ACTION POTENTIAL AND VECTORS
- 4. CLINICAL FEATURES
- 4.1 CARDIAC ENLARGEMENT AND HYPERTROPHY
- 4.2 BUNDLE BRANCH BLOCKS AND RELATED PATTERNS
- 5. DIFFERENTIAL DIAGNOSIS
- 5.1 DIFFERENTIAL DIAGNOSIS OF ST-SEGMENT ELEVATIONS
- 6. INVESTIGATIONS & DIAGNOSIS
- 6.1 METABOLIC FACTORS AND DRUG EFFECTS
- 6.2 NONSPECIFIC ST-T CHANGES AND LOW QRS VOLTAGE
- 7. MANAGEMENT & TREATMENT
- 8. PROGNOSIS & COMPLICATIONS
- 9. SPECIAL CONSIDERATIONS
- 10. KEY PEARLS & CLINICAL TRAPS
- Figures & Illustrations
📋 Figures in This Chapter
1. DEFINITION & OVERVIEW
- An electrocardiogram (ECG or EKG) is a graphical representation of electrical activity generated by the heart.
- Signals are detected by metallic electrodes attached to the extremities and chest wall.
- Signals are amplified and recorded by the electrocardiograph device.
- ECG leads are configured to display the instantaneous differences in electrical potentials between specific sets of electrodes.
- Utility derives from immediate availability as a noninvasive, inexpensive, and highly versatile test.
- Used in detecting arrhythmias, conduction disturbances, and myocardial ischemia/infarction.
- May reveal findings related to life-threatening metabolic disturbances, drug toxicities, and increased susceptibility to sudden cardiac arrest.
- Importance in diagnosis, prognosis, and management of muscular dystrophies and other hereditary neuromuscular diseases is discussed separately.
1.1 BASIC ECG WAVEFORMS AND INTERVALS
- ECG waveforms are labeled alphabetically, beginning with the P wave.
- P wave represents atrial depolarization.
- QRS complex represents ventricular depolarization.
- ST-T-U complex (ST segment, T wave, and U wave) represents ventricular repolarization.
- J point is the junction between the end of the QRS complex and the beginning of the ST segment.
- Atrial repolarization waveforms (ST-T) are usually too low in amplitude to be detected.
- Atrial repolarization may become apparent in acute pericarditis, atrial infarction, and AV heart block syndromes.
- QRS-T waveforms of the surface ECG correspond to sequential phases of simultaneously obtained ventricular action potentials.
- Rapid upstroke (phase 0) of the action potential corresponds to the onset of QRS.
- Plateau (phase 2) corresponds to the isoelectric ST segment.
- Active repolarization (phase 3) corresponds to the inscription of the T wave.
- Factors that decrease the slope of phase 0 by impairing the influx of Na+ (e.g., hyperkalemia and drugs such as flecainide) tend to increase QRS duration.
- Factors that prolong phase 2 or 3 (e.g., amiodarone, hypocalcemia) increase the QT interval.
- Factors associated with shortening of ventricular repolarization duration (e.g., hypercalcemia, digoxin) abbreviate the QT.
- Hereditary short QT syndrome and its relationship to sudden cardiac arrest are discussed separately.
1.2 ECG LEADS AND GRID
- The ECG is usually recorded on graph paper divided into a grid of 1-mm² boxes.
- When the recording (sweep) speed is 25 mm/s, the smallest (1 mm) horizontal divisions correspond to 40 ms (0.04 s).
- Heavier lines at intervals of 200 ms (0.20 s).
- Vertically, the ECG graph measures the amplitude of a specific wave or deflection (1 mV = 10 mm with standard calibration).
- Voltage criteria for hypertrophy mentioned below are given in millimeters.
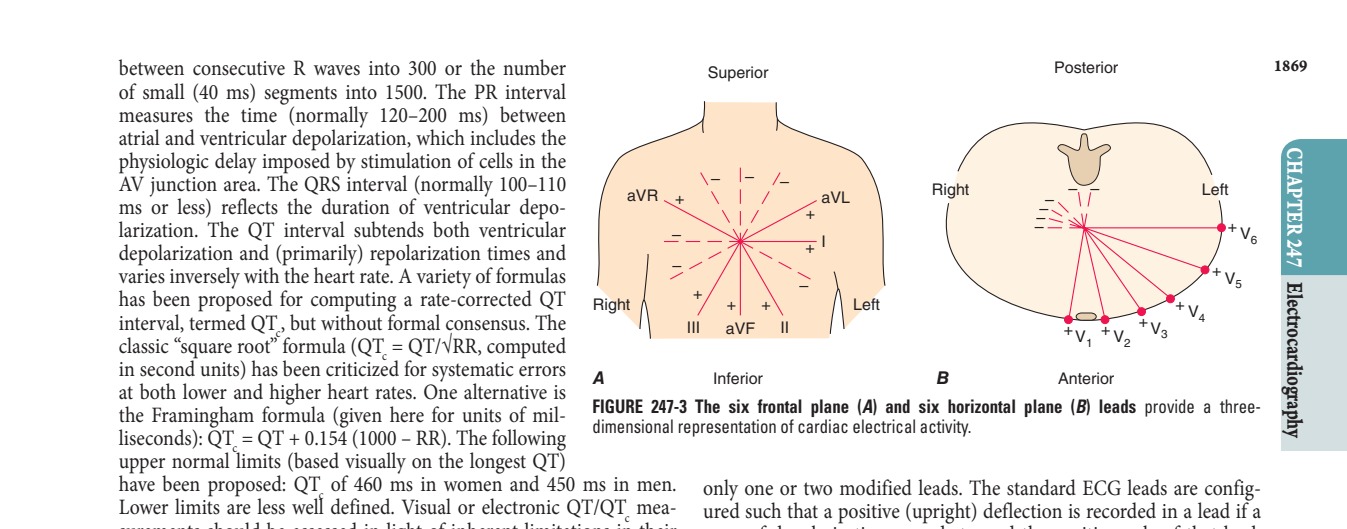
- The 12 conventional ECG leads are divided into two groups: six limb (extremity) leads and six chest (precordial) leads.
- Limb leads record potentials transmitted onto the frontal plane.
- Chest leads record potentials transmitted onto the horizontal plane.
- Each lead is analogous to a different video camera angle looking at the same events.
- The 12-lead ECG can be supplemented with additional leads in special circumstances.
- Right precordial leads VR to VR are useful in detecting evidence of acute right ventricular ischemia/infarction.
- Bedside monitors and ambulatory ECGs usually employ only one or two modified leads.
- Standard ECG leads are configured such that a positive (upright) deflection is recorded in a lead if a wave of depolarization spreads toward the positive pole of that lead.
- A negative deflection is recorded if the wave spreads toward the negative pole.
- If the mean orientation of the depolarization vector is at right angles to a particular lead axis, a biphasic (equally positive and negative) deflection will be inscribed.
2. EPIDEMIOLOGY
- The text does not provide specific incidence or prevalence data for ECG abnormalities.
- ECG abnormalities are common in various conditions including ischemic heart disease, cardiomyopathies, and metabolic disturbances.
3. ETIOLOGY & PATHOPHYSIOLOGY
- Depolarization of the heart is the initiating event for cardiac contraction.
- Electrical currents that spread through the heart are produced by three components: cardiac pacemaker cells, specialized conduction tissue, and the heart muscle itself.
- The ECG records only the depolarization (stimulation) and repolarization (recovery) electrical activity generated by the working atrial and ventricular myocardium.
- The stimulus initiating the normal heartbeat originates in the sinoatrial (SA) node.
- The SA node possesses spontaneous automaticity.
- Spread of the depolarization wave through the right and left atria induces contraction of these chambers.
- Next, the impulse spreads to the AV node, AV junction, His bundle, bundle branches, and Purkinje fibers.
- The bundle of His bifurcates into two main divisions: the right and left bundle branches.
- The main left bundle fans out into left anterior and left posterior fascicular subdivisions.
- Depolarization wavefronts then spread through the ventricular wall, from endocardium to epicardium, triggering coordinated ventricular contraction.
- Since the cardiac depolarization and repolarization wavefronts have direction and magnitude, they can be represented by vectors.
3.1 ACTION POTENTIAL AND VECTORS
- The QRS-T waveforms of the surface ECG correspond to sequential phases of simultaneously obtained ventricular action potentials.
- Intracellular recordings from single myocardial fibers are discussed separately.
- The rapid upstroke (phase 0) of the action potential corresponds to the onset of QRS.
- The plateau (phase 2) corresponds to the isoelectric ST segment.
- Active repolarization (phase 3) corresponds to the inscription of the T wave.
- Factors that decrease the slope of phase 0 by impairing the influx of Na+ (e.g., hyperkalemia and drugs such as flecainide) tend to increase QRS duration.
- Factors that prolong phase 2 or 3 (e.g., amiodarone, hypocalcemia) increase the QT interval.
- Factors associated with shortening of ventricular repolarization duration (e.g., hypercalcemia, digoxin) abbreviate the QT.
4. CLINICAL FEATURES
- The normal atrial depolarization vector is oriented downward and toward the subject's left.
- This reflects the spread of depolarization from the sinus node to the right and then the left atrial myocardium.
- Since this vector points toward the positive pole of lead II and toward the negative pole of lead aVR, the sinus-generated P wave will be positive in lead II and negative in aVR.
- Activation of the atria from an ectopic pacemaker in the lower part of either atrium or in the AV junction region may produce retrograde P waves (negative in II, positive in aVR).
- The normal P wave in lead V may be biphasic with a positive component reflecting right atrial depolarization, followed by a small (<1 mm²) negative component reflecting left atrial depolarization.
- Normal ventricular depolarization proceeds as a rapid, continuous spread of activation wave fronts.
- This complex process can be divided into two major sequential phases, and each can be represented by a mean vector.
- The first and shortest phase is depolarization of the interventricular septum, proceeding from the left to the right and anteriorly.
- This process is represented by a small septal r wave in lead V and a small q wave in lead V.
- The second and major phase results from the simultaneous depolarization of the right and left ventricles.
- This phase is normally dominated by the more massive left ventricle, so that vector 2 points leftward and posteriorly.
- Therefore, a right precordial lead (V) will record this biphasic depolarization process with a small positive deflection (septal r wave) followed by a larger negative deflection (S wave).
- A left precordial lead, for example, V, will record the same sequence with a small negative deflection (septal q wave) followed by a relatively tall positive deflection (R wave).
- Intermediate leads show a relative increase in R-wave amplitude (normal R-wave progression) and a decrease in S-wave amplitude progressing across the chest from right to left.
- The lead where the R and S waves are of about equal amplitude is referred to as the transition zone (usually V or V).
- The QRS pattern in the extremity leads may vary considerably from one normal subject to another depending on the electrical axis of the QRS.
- Normally, the QRS axis ranges from –30° to +100°.
- An axis more negative than –30° is referred to as left axis deviation.
- An axis more positive than +90 to +100° is referred to as right axis deviation.
- Left axis deviation may occur as a normal variant but is more commonly associated with left ventricular hypertrophy, a block in the anterior fascicle of the left bundle system (left anterior fascicular block or hemiblock), or inferior myocardial infarction.
- Right axis deviation also may occur as a normal variant (particularly in children and young adults), as a spurious finding due to reversal of the left and right arm electrodes, or in conditions such as right ventricular overload (acute or chronic), lateral infarction, dextrocardia, left pneumothorax, and left posterior fascicular block.
- Normally, the mean T-wave vector is oriented roughly concordant with the mean QRS vector (within about 45° in the frontal plane).
- Since depolarization and repolarization are electrically opposite processes, this normal QRS–T-wave vector concordance indicates that repolarization normally must proceed in the reverse direction from depolarization (i.e., from ventricular epicardium to endocardium).
- The normal U wave is a small, rounded deflection (≤1 mm) that follows the T wave and usually has the same polarity as the T wave.
- An abnormal increase in U-wave amplitude is most commonly due to hypokalemia or drugs (e.g., dofetilide, amiodarone, sotalol, quinidine).
- Very prominent U waves, as part of prolonged ventricular repolarization syndromes, are a marker of increased susceptibility to torsades de pointes.
4.1 CARDIAC ENLARGEMENT AND HYPERTROPHY
- Right atrial overload (acute or chronic) may lead to an increase in P-wave amplitude (≥2.5 mm), previously referred to as P-pulmonale.
- Left atrial overload typically produces a biphasic P wave in one or more limb leads.
- This pattern, historically referred to as P-mitrale, may occur with interatrial conduction delays in the absence of actual atrial enlargement, leading to the more general designation of left atrial abnormality.
- Right ventricular hypertrophy due to a sustained, severe pressure load (e.g., with pulmonic valve stenosis or certain pulmonary artery hypertension syndromes) is characterized by a relatively tall R wave in lead V (R ≥ S wave), usually with right axis deviation.
- Alternatively, there may be a qR pattern in V or VR.
- ST depression and T-wave inversion in the right to mid-precordial leads are also present.
- Chronic cor pulmonale due to obstructive lung disease usually does not produce the classic ECG patterns of right ventricular hypertrophy noted above.
- Instead of tall right precordial R waves, emphysema is more typically associated with diminished r waves in right to mid-precordial leads (slow R-wave progression) due in part to downward displacement of the diaphragm and the heart.
- Low-voltage complexes are commonly present, owing to hyperaeration.
- Multiple voltage criteria for left ventricular hypertrophy have been proposed based on the presence of tall left precordial R waves and deep right precordial S waves (e.g., SV1 + [RV5 or RV6] > 35 mm).
- Repolarization abnormalities (ST depression with T-wave inversions, formerly called the left ventricular strain pattern) may appear in leads with prominent R waves.
- However, prominent precordial voltages occur as a common normal variant, especially in athletic or young individuals.
- Left ventricular hypertrophy may increase limb lead voltage with or without increased precordial voltage (e.g., RaVL + SV3 > 20 mm in women and > 28 mm in men).
- The presence of left atrial abnormality is often present.
- This pattern, formerly called right ventricular strain, increases the likelihood of underlying left ventricular hypertrophy in cases with borderline voltage criteria.
- Left ventricular hypertrophy often progresses to incomplete or complete left bundle branch block.
- The sensitivities of conventional voltage criteria for left ventricular hypertrophy are low in middle age to older adults and may be decreased further in obese persons and smokers, as well as with right bundle branch block.
- ECG evidence for left ventricular hypertrophy is a major noninvasive marker of increased risk of cardiovascular morbidity and mortality rates, including sudden cardiac death.
- However, because of false-positive and false-negative diagnoses, the ECG is of limited utility in diagnosing atrial or ventricular enlargement.
- More definitive anatomic and functional information is provided by echocardiographic and cardiac magnetic resonance imaging studies.
Table 1 — Voltage Criteria for Left Ventricular Hypertrophy
| Criterion | Value |
|---|---|
| SV1 + RV5 or RV6 | > 35 mm |
| RaVL + SV3 | > 20 mm in women; > 28 mm in men |
4.2 BUNDLE BRANCH BLOCKS AND RELATED PATTERNS
- Intrinsic impairment of conduction in either the right or the left bundle system (intraventricular conduction disturbances) leads to prolongation of the QRS interval.
- With complete bundle branch blocks, the widest QRS interval is ≥120 ms in duration.
- With incomplete blocks, the QRS interval is between about 110 and 120 ms.
- The QRS vector usually is oriented in the direction of the myocardial region where depolarization is delayed.
- Thus, with right bundle branch block, the terminal QRS vector is oriented to the right and anteriorly (rSR' in V1, typically).
- Left bundle branch block alters both early and later phases of ventricular depolarization.
- The major QRS vector is directed to the left and posteriorly.
- In addition, the normal early left-to-right pattern of septal activation is disrupted such that septal depolarization proceeds from right to left as well.
- As a result, left bundle branch block generates wide, predominantly negative (QS) complexes in lead V and entirely positive (R) complexes in V.
- Waveform patterns identical to those of left bundle branch block, preceded by a sharp (sometimes very low amplitude) spike, are seen in most cases of electronic right ventricular pacing due to the relative delay in left ventricular activation.
- Bundle branch block may occur in a variety of conditions.
- In subjects without structural heart disease, right bundle branch block is seen more commonly than left bundle branch block.
- Right bundle branch block also occurs with heart disease, both congenital (e.g., atrial septal defect) and acquired (e.g., valvular, ischemic).
- Left bundle branch block is often a marker of one of four underlying conditions associated with increased risk of cardiovascular morbidity and mortality rates: coronary heart disease (frequently with impaired left ventricular function), hypertensive heart disease, aortic valve disease (including after transcatheter aortic valve replacement), and cardiomyopathy.
- Bundle branch blocks and depolarization abnormalities secondary to artificial pacemakers not only affect ventricular depolarization (QRS) but also are characteristically associated with secondary repolarization (ST-T) abnormalities.
- With bundle branch blocks, the T wave is typically opposite in polarity to the last deflection of the QRS.
- This discordance of the QRS–T-wave vectors is caused by the altered sequence of repolarization that occurs as a consequence of altered depolarization.
- In contrast, primary repolarization abnormalities are independent of QRS changes and are related instead to actual alterations in the electrical properties of the myocardial fibers themselves (e.g., in the resting membrane potential or action potential duration), not just to changes in the sequence of repolarization.
- Ischemia, electrolyte imbalance, and drugs such as digoxin all cause such primary ST–T-wave changes.
- Primary and secondary T-wave changes may coexist.
- For example, T-wave inversions in the right precordial leads with left bundle branch block or in the left precordial leads with right bundle branch block may be important markers of underlying ischemia or other abnormalities.
- A distinctive abnormality simulating right bundle branch block with ST-segment elevations in the right chest leads is seen with the Brugada pattern.
- Partial blocks in the left bundle system (left anterior or posterior fascicular blocks; formerly called hemiblocks) generally do not prolong QRS duration substantially.
- Instead, they are associated with shifts in the frontal plane QRS axis (leftward or rightward, respectively).
- Left anterior fascicular block (QRS axis more negative than –45°) is probably the most common cause of marked left axis deviation in adults.
- In contrast, left posterior fascicular block (QRS axis more rightward than +110–120°) is extremely rare as an isolated finding and requires exclusion of other factors causing right axis deviation.
- Intraventricular conduction delays also can be caused by factors extrinsic (toxic) to the conduction system that slow ventricular conduction, particularly hyperkalemia or drugs (e.g., class 1 antiarrhythmic agents, tricyclic antidepressants, phenothiazines).
- Prolongation of QRS duration does not necessarily indicate a conduction delay but may be due to preexcitation of the ventricles via a bypass tract, as in Wolff-Parkinson-White (WPW) patterns and related variants.
5. DIFFERENTIAL DIAGNOSIS
- The ECG has important limitations in both sensitivity and specificity in the diagnosis of acute and chronic ischemic heart disease.
- Although a single normal ECG does not exclude ischemia or even acute infarction, a normal ECG throughout the course of an acute infarct is distinctly uncommon.
- Prolonged chest pain without diagnostic ECG changes therefore should always prompt a careful search for other noncoronary causes of chest pain.
- Furthermore, the diagnostic changes of acute or evolving ischemia are often masked by the presence of left bundle branch block, electronic ventricular pacemaker patterns, and WPW preexcitation.
- However, clinicians may also overdiagnose myocardial ischemia or infarction based on the presence of ST-segment elevations or depressions; T-wave inversions; tall, positive T waves; or Q waves not related to ischemic heart disease (pseudoinfarct patterns).
- ST-segment elevations simulating acute ischemia/infarction may occur with acute pericarditis or myocarditis, including COVID-19 infections, as a normal variant (including the typical early repolarization pattern), or in a variety of other conditions.
- Similarly, tall T waves do not invariably represent hyperacute ischemic changes but may also be caused by normal variants, hyperkalemia, or cerebrovascular injury, among other causes.
- ST-segment elevations and tall, positive T waves are common findings in leads V1 and V2 in left bundle branch block or left ventricular hypertrophy in the absence of ischemia.
- The differential diagnosis of Q waves includes physiologic or positional variants, ventricular hypertrophy, acute or chronic noncoronary myocardial injury, hypertrophic cardiomyopathy, and ventricular conduction disorders.
- Ventricular hypertrophy, hypokalemia, drugs such as digoxin, and a variety of other factors may cause ST-segment depression mimicking subendocardial ischemia.
- Prominent T-wave inversion may occur with ischemia, electrolyte imbalance, and drugs such as digoxin.
5.1 DIFFERENTIAL DIAGNOSIS OF ST-SEGMENT ELEVATIONS
- Myocardial ischemia/infarction
- Noninfarction transmural ischemia (e.g., Prinzmetal's syndrome)
- Acute myocardial infarction
- Due to atherosclerotic coronary occlusion
- Due to nonatherosclerotic causes (e.g., takotsubo syndrome, coronary dissection)
- Post-myocardial infarction (left ventricular motion abnormality/aneurysm)
- Acute pericarditis
- Normal variants (including benign early repolarization patterns)
- Left ventricular hypertrophy/left bundle branch block
- Other (rarer)
- Acute pulmonary embolism
- Brugada patterns (right bundle branch block-like morphology with elevations in right precordial leads)
- Class 1C antiarrhythmic drugs
- DC cardioversion (transient)
- Hypercalcemia
- Hyperkalemia
- Hypothermia (J [Osborn] waves)
- Nonischemic myocardial injury
- Myocarditis syndromes (infectious and noninfectious)
- Tumor invading left ventricle
- Trauma to ventricles
Table 2 — Differential Diagnosis of ST-Segment Elevations
| Condition | Notes |
|---|---|
| Myocardial ischemia/infarction | Due to atherosclerotic coronary occlusion |
| Noninfarction transmural ischemia | e.g., Prinzmetal's syndrome |
| Acute myocardial infarction | Due to nonatherosclerotic causes (e.g., takotsubo syndrome, coronary dissection) |
| Post-myocardial infarction | Left ventricular motion abnormality/aneurysm |
| Acute pericarditis | |
| Normal variants | Including benign early repolarization patterns |
| Left ventricular hypertrophy/left bundle branch block | Usually localized to V1–V3 or V2 |
| Acute pulmonary embolism | |
| Brugada patterns | Right bundle branch block-like morphology with elevations in right precordial leads |
| Class 1C antiarrhythmic drugs | |
| DC cardioversion | Transient |
| Hypercalcemia | Usually localized to V1–V3 or V2 |
| Hyperkalemia | Usually localized to V1–V3 or V2 |
| Hypothermia | J [Osborn] waves |
| Nonischemic myocardial injury | |
| Myocarditis syndromes | Infectious and noninfectious |
| Tumor invading left ventricle | |
| Trauma to ventricles |
6. INVESTIGATIONS & DIAGNOSIS
- The ECG is central to the diagnosis of acute and chronic ischemic heart disease.
- Ischemia exerts complex time-dependent effects on the electrical properties of myocardial cells.
- Severe, acute ischemia lowers the resting membrane potential and shortens the duration of the action potential.
- Such changes cause a voltage gradient between normal and ischemic zones.
- As a consequence, current flows between those regions.
- These currents of injury are represented on the surface ECG by deviation of the ST segment.
- When the acute ischemia is transmural, the ST vector usually is shifted in the direction of the outer (epicardial) layers, producing ST elevations and sometimes, in the earliest stages of ischemia, tall, positive so-called hyperacute T waves over the ischemic zone.
- With ischemia confined primarily to the subendocardium, the ST vector typically shifts toward the subendocardium and ventricular cavity, so that overlying (e.g., anterior precordial) leads show ST-segment depression (with ST elevation in lead aVR).
- Multiple factors affect the amplitude of acute ischemic ST deviations.
- Profound ST elevation or depression in multiple leads usually indicates very severe ischemia.
- The division of acute myocardial infarction due to obstructive coronary artery disease into ST-segment elevation and non-ST elevation types is useful since the consistent efficacy of emergency (minutes to hours) reperfusion therapy is limited to the former group.
- Indications for acute reperfusion therapy in non-ST elevation myocardial infarction are a focus of ongoing investigation.
- Takotsubo syndrome, as well as other causes of myocardial infarction without atherosclerotic coronary disease, can simulate the patterns of acute or evolving ST-segment elevation or non-ST-segment elevation infarction.
- The ECG leads are usually more helpful in localizing regions of ST elevation than non-ST elevation ischemia.
- For example, acute transmural anterior (including apical and lateral) wall ischemia is reflected by ST elevations or increased T-wave positivity in one or more of the precordial leads (V1–V6) and leads I and aVL.
- Inferior wall ischemia produces changes in leads II, III, and aVF.
- Posterior wall ischemia (almost always associated with lateral or inferior involvement) may be indirectly recognized by reciprocal ST depressions in leads V1 to V3 (thus constituting an ST elevation equivalent acute coronary syndrome).
- Acute right ventricular ischemia usually produces ST elevations in right-sided chest leads.
- When ischemic ST elevations occur as the earliest sign of acute infarction, they typically are followed within a period ranging from hours to days by evolving T-wave inversions and often by Q waves occurring in the same lead distribution.
- Reversible transmural ischemia, for example, due to coronary vasospasm (Prinzmetal's angina) may cause transient ST-segment elevations without development of Q waves.
- Depending on the severity and duration of ischemia, ischemic ST elevations may resolve completely in minutes or be followed by T-wave inversions that persist for hours or even days.
- Patients with ischemic chest pain who present with deep T-wave inversions in multiple precordial leads (e.g., V1–V6, and sometimes I and aVL) with or without cardiac enzyme elevations typically have severe obstruction in the left anterior descending coronary artery.
- With infarction, depolarization (QRS) changes often accompany repolarization (ST-T) abnormalities.
- Necrosis of sufficient myocardial tissue may lead to decreased R-wave amplitude or abnormal Q waves (even in the absence of transmural ischemia) in the anterior or inferior leads.
- Abnormal Q waves were once considered markers of transmural myocardial infarction, whereas subendocardial infarcts were thought not to produce Q waves.
- However, transmural infarcts may occur without Q waves, and subendocardial (nontransmural) infarcts may be associated with Q waves.
- Therefore, evolving or chronic infarcts are more appropriately classified as Q-wave or non-Q-wave.
- Loss of depolarization forces due to posterior or lateral infarction may cause reciprocal increases in R-wave amplitude in leads V1 and V2 without diagnostic Q waves in any of the conventional leads.
- In the weeks and months after infarction, these ECG changes may persist or begin to resolve.
- Complete normalization of the ECG after Q-wave infarction is uncommon but may occur, particularly with smaller infarcts.
- In contrast, ST-segment elevations that persist for several weeks or more after a Q-wave infarct usually correlate with a severe underlying wall motion disorder, although not necessarily a frank ventricular aneurysm.
- A variety of metabolic abnormalities and pharmacologic agents alter the ECG and, in particular, cause changes in repolarization (ST-T-U) and sometimes QRS prolongation.
- Certain life-threatening electrolyte perturbations may be diagnosed initially and monitored from the ECG.
- Hyperkalemia produces a sequence of changes, usually beginning with narrowing and peaking (tenting) of the T waves.
- Further elevation of extracellular K+ leads to AV conduction disturbances, diminution in P-wave amplitude, and widening of the QRS interval.
- Severe hyperkalemia eventually causes cardiac arrest with a slow sinusoidal type of mechanism (sine-wave pattern) followed by asystole.
- Hypokalemia prolongs ventricular repolarization, often with prominent U waves.
- Prolongation of the QT interval is also seen with drugs that increase the duration of the ventricular action potential: class 1A antiarrhythmic agents and related drugs (e.g., quinidine, procainamide, tricyclic antidepressants, phenothiazines) and class III agents (e.g., amiodarone, dofetilide, sotalol, ibutilide).
- Systemic hypothermia also prolongs repolarization, usually with a distinctive convex elevation of the J point (Osborn wave) and bradycardia.
- Marked QT prolongation, sometimes with deep, wide T-wave inversions, may occur with intracranial bleeds, particularly subarachnoid hemorrhage (CVA T-wave pattern).
- Hypocalcemia typically prolongs the QT interval (ST portion), whereas hypercalcemia shortens it.
- Digitalis glycosides also shorten the QT interval, often with a characteristic scooping of the ST–T-wave complex (digitalis effect).
- Electrical alternans—a beat-to-beat alternation in one or more components of the ECG signal—is a common type of nonlinear cardiovascular response to a variety of hemodynamic and electrophysiologic factors.
- Total electrical alternans (P-QRS-T) with sinus tachycardia is a relatively specific sign of pericardial effusion, usually with cardiac tamponade.
- In contrast, pure repolarization alternans is less specific.
6.1 METABOLIC FACTORS AND DRUG EFFECTS
- Hyperkalemia produces a sequence of changes (Fig. 247-14).
- Hyperkalemia sequence: T-wave peaking → QRS widening → P-wave diminution → sine-wave pattern → asystole.
- Hypokalemia prolongs ventricular repolarization, often with prominent U waves.
- Prolongation of the QT interval is also seen with drugs that increase the duration of the ventricular action potential.
- Systemic hypothermia also prolongs repolarization, usually with a distinctive convex elevation of the J point (Osborn wave) and bradycardia.
- Marked QT prolongation, sometimes with deep, wide T-wave inversions, may occur with intracranial bleeds, particularly subarachnoid hemorrhage (CVA T-wave pattern).
- Hypocalcemia typically prolongs the QT interval (ST portion), whereas hypercalcemia shortens it.
- Digitalis glycosides also shorten the QT interval, often with a characteristic scooping of the ST–T-wave complex (digitalis effect).
- Electrical alternans—a beat-to-beat alternation in one or more components of the ECG signal—is a common type of nonlinear cardiovascular response to a variety of hemodynamic and electrophysiologic factors.
- Total electrical alternans (P-QRS-T) with sinus tachycardia is a relatively specific sign of pericardial effusion, usually with cardiac tamponade.
- In contrast, pure repolarization alternans is less specific.
6.2 NONSPECIFIC ST-T CHANGES AND LOW QRS VOLTAGE
- Many other factors are associated with ECG changes, particularly alterations in ventricular repolarization.
- T-wave flattening, minimal T-wave inversions, or slight ST-segment depression (nonspecific ST–T-wave changes) may occur with a variety of electrolyte and acid-base disturbances, infectious or inflammatory processes, central nervous system disorders, endocrine abnormalities, many drugs, ischemia, hypoxia, and virtually any type of cardiopulmonary abnormality, in addition to ventricular hypertrophy, cardiomyopathies, myocarditis, and stress physiologic changes (e.g., with posture or after meals).
- Low QRS voltage is arbitrarily defined as peak-to-trough QRS amplitudes of ≤5 mm in the six limb leads and/or ≤10 mm in the chest leads.
- Multiple factors may be responsible.
- Among the most serious include pericardial or pleural effusions, chronic obstructive pulmonary disease, cardiac amyloid, and anasarca.
7. MANAGEMENT & TREATMENT
- The ECG is primarily a diagnostic tool.
- Management of underlying conditions (e.g., ischemia, infarction, electrolyte disturbances) is the primary treatment.
- Emergency reperfusion therapy is indicated for ST-segment elevation myocardial infarction.
- Indications for acute reperfusion therapy in non-ST elevation myocardial infarction are a focus of ongoing investigation.
- Treatment of hyperkalemia involves calcium, insulin/glucose, and beta-agonists.
- Treatment of hypokalemia involves potassium supplementation.
- Treatment of hypothermia involves active rewarming.
- Treatment of pericardial effusion with tamponade involves pericardiocentesis.
8. PROGNOSIS & COMPLICATIONS
- ECG evidence for left ventricular hypertrophy is a major noninvasive marker of increased risk of cardiovascular morbidity and mortality rates, including sudden cardiac death.
- However, because of false-positive and false-negative diagnoses, the ECG is of limited utility in diagnosing atrial or ventricular enlargement.
- More definitive anatomic and functional information is provided by echocardiographic and cardiac magnetic resonance imaging studies.
- Prominent repolarization prolongation, particularly if due to hypokalemia, inherited channelopathies, or certain pharmacologic agents, indicates increased susceptibility to torsades des pointes ventricular tachycardia.
- Complete normalization of the ECG after Q-wave infarction is uncommon but may occur, particularly with smaller infarcts.
- In contrast, ST-segment elevations that persist for several weeks or more after a Q-wave infarct usually correlate with a severe underlying wall motion disorder, although not necessarily a frank ventricular aneurysm.
9. SPECIAL CONSIDERATIONS
- The ECG may reveal findings related to life-threatening metabolic disturbances, drug toxicities, and increased susceptibility to sudden cardiac arrest.
- The importance of electrocardiologic abnormalities in the diagnosis, prognosis, and management of muscular dystrophies and other hereditary neuromuscular diseases is discussed separately.
- Bundle branch blocks and depolarization abnormalities secondary to artificial pacemakers not only affect ventricular depolarization (QRS) but also are characteristically associated with secondary repolarization (ST-T) abnormalities.
- Intraventricular conduction delays also can be caused by factors extrinsic (toxic) to the conduction system that slow ventricular conduction, particularly hyperkalemia or drugs (e.g., class 1 antiarrhythmic agents, tricyclic antidepressants, phenothiazines).
- Prolongation of QRS duration does not necessarily indicate a conduction delay but may be due to preexcitation of the ventricles via a bypass tract, as in Wolff-Parkinson-White (WPW) patterns and related variants.
- Low QRS voltage is arbitrarily defined as peak-to-trough QRS amplitudes of ≤5 mm in the six limb leads and/or ≤10 mm in the chest leads.
- Multiple factors may be responsible, including pericardial or pleural effusions, chronic obstructive pulmonary disease, cardiac amyloid, and anasarca.
10. KEY PEARLS & CLINICAL TRAPS
- Although a single normal ECG does not exclude ischemia or even acute infarction, a normal ECG throughout the course of an acute infarct is distinctly uncommon.
- Prolonged chest pain without diagnostic ECG changes therefore should always prompt a careful search for other noncoronary causes of chest pain.
- Furthermore, the diagnostic changes of acute or evolving ischemia are often masked by the presence of left bundle branch block, electronic ventricular pacemaker patterns, and WPW preexcitation.
- However, clinicians may also overdiagnose myocardial ischemia or infarction based on the presence of ST-segment elevations or depressions; T-wave inversions; tall, positive T waves; or Q waves not related to ischemic heart disease (pseudoinfarct patterns).
- ST-segment elevations simulating acute ischemia/infarction may occur with acute pericarditis or myocarditis, including COVID-19 infections, as a normal variant (including the typical early repolarization pattern), or in a variety of other conditions.
- Similarly, tall T waves do not invariably represent hyperacute ischemic changes but may also be caused by normal variants, hyperkalemia, or cerebrovascular injury, among other causes.
- ST-segment elevations and tall, positive T waves are common findings in leads V1 and V2 in left bundle branch block or left ventricular hypertrophy in the absence of ischemia.
- The differential diagnosis of Q waves includes physiologic or positional variants, ventricular hypertrophy, acute or chronic noncoronary myocardial injury, hypertrophic cardiomyopathy, and ventricular conduction disorders.
- Ventricular hypertrophy, hypokalemia, drugs such as digoxin, and a variety of other factors may cause ST-segment depression mimicking subendocardial ischemia.
- Prominent T-wave inversion may occur with ischemia, electrolyte imbalance, and drugs such as digoxin.
- Very prominent U waves, as part of prolonged ventricular repolarization syndromes, are a marker of increased susceptibility to torsades de pointes.
- Total electrical alternans (P-QRS-T) with sinus tachycardia is a relatively specific sign of pericardial effusion, usually with cardiac tamponade.
- Marked QT prolongation, sometimes with deep, wide T-wave inversions, may occur with intracranial bleeds, particularly subarachnoid hemorrhage (CVA T-wave pattern).
- Osborn wave: Distinctive convex elevation of the J point seen in systemic hypothermia.
- Wellens T wave sign: Deep T-wave inversions in precordial leads (V1–V6) associated with high-grade stenosis of the left anterior descending coronary artery.
Figures & Illustrations
Reproduced from Harrison's 22nd Edition.
Figure 1

Caption: FIGURE 247-14 The earliest ECG change with hyperkalemia is usually peaking the QRS complexes widen, the P waves decrease in amplitude and may disappear, and (Reproduced with permission from AL Goldberger et al: Goldberger’s Clinical — Figure 247-1: Schematic of the cardiac conduction system showing the sinoatrial (SA) node, atrioventricular (AV) junction, bundle of His, right and left bundle branches, and Purkinje fibers.
Figure 2

Caption: FIGURE 247-10 Comparison of typical QRS-T patterns in right bundle branch block (RBBB) and left bundle branch block (LBBB) with the normal pattern in leads V and V. 1 6 Note the secondary T-wave inversions (arrows) in leads with an rSR′ complex with RBBB and in leads with a wide R wave with LBBB. heart disease (frequently with impaired left ventricular function), hyper- tensive heart disease, aortic valve disease (including after transcatheter aortic valve replacement), and cardiomyopathy. Bundle branch blocks may be chronic or intermittent. A bundle branch block may be rate- related, most commonly observed when the heart rate exceeds some — Figure 247-2: Basic ECG waveforms and intervals including the P wave, QRS complex, ST segment, T wave, U wave, and the J point.
Figure 3

Caption: FIGURE 247-8 Right atrial (RA) overload may cause tall, peaked P waves in the limb or precordial leads. Left atrial (LA) abnormality may cause broad, often notched P waves in the limb leads and a biphasic P wave in lead V with a prominent 1 a negative component representing delayed depolarization of the LA. (Reproduced with permission from MK Park, WG Guntheroth: How to Read Pediatric ECGs, 4th ed. St. Louis, Mosby/Elsevier, 2006.) often present. This pattern, formerly called right ventricular “strain,” is attributable to repolarization abnormalities in acutely or chroni- cally overloaded muscle. Prominent S waves may occur in the left — Figure 247-3: The six frontal plane (limb) and six horizontal plane (precordial) leads providing a three-dimensional representation of cardiac electrical activity.
Figure 4
Caption: FIGURE 247-3 The six frontal plane (A) and six horizontal plane (B) leads provide a three- the Framingham formula (given here for units of mil- dimensional representation of cardiac electrical activity. liseconds): QT = QT + 0.154 (1000 – RR). The following c upper normal limits (based visually on the longest QT) have been proposed: QT of 460 ms in women and 450 ms in men. only one or two modified leads. The standard ECG leads are config- c Lower limits are less well defined. Visual or electronic QT/QT mea- ured such that a positive (upright) deflection is recorded in a lead if a c surements should be assessed in light of inherent limitations in their wave of depolarization spreads toward the positive pole of that lead, precise determination from standard ECGs waveforms. and a negative deflection is recorded if the wave spreads toward the negative pole. If the mean orientation of the depolarization vector is at — Figure 247-4: The frontal plane (limb or extremity) leads represented on a hexaxial diagram showing the positive and negative poles and the mean electrical axis.
Figure 5

Caption: FIGURE 247-12 Severe anterior wall ischemia (with or without infarction) may cause pattern (sometimes referred to as the Wellens T wave sign) is usually associated with a ischemia, for example, due to coronary vasospasm (Prinzmetal’s angina) may cause transient ST-segment elevations without development of Q waves. Depending on the severity and duration of ischemia, ischemic ST elevations may resolve completely in minutes or be followed by T-wave inversions that persist for hours or even days. Patients with ischemic chest pain who present with deep T-wave inversions in mul- tiple precordial leads (e.g., V–V, and sometimes I and aVL) with or 1 4 — Figure 247-5: The horizontal plane (chest or precordial) leads obtained with electrodes in the locations shown, including additional posterior leads (V7–V9).
Figure 6

Caption: FIGURE 247-15 A variety of metabolic derangements, drug effects, and other factors Prominent repolarization prolongation, particularly if due to hypokalemia, inherited to torsades des pointes ventricular tachycardia (Chap. 261). Marked systemic arrow) attributed to altered transmural ventricular action potential characteristics. antidepressant overdose. — Figure 247-6: Ventricular depolarization divided into two major phases: septal depolarization (vector 1) and simultaneous depolarization of the right and left ventricles (vector 2).
Figure 7

Caption: FIGURE 247-6 Ventricular depolarization can be divided into two major phases, ■ CARDIAC ENLARGEMENT AND each represented by a vector. A. The first phase (arrow 1) denotes depolarization Right atrial overload (acute or chronic) of the ventricular septum, beginning on the left side and spreading to the right. This P-wave amplitude (≥2.5 mm) (Fig. 247-8), process is represented by a small “septal” r wave in lead V and a small septal 1 “P-pulmonale.” Left atrial overload typically q wave in lead V. B. Simultaneous depolarization of the left and right ventricles 6 V with a broad negative component or a (LV and RV) constitutes the second phase. Vector 2 is oriented to the left and 1 posteriorly, reflecting the electrical predominance of the LV. C. Vectors (arrows) a notched P wave in one or more limb leads representing these two phases are shown in reference to the horizontal plane historically referred to as “P-mitrale,” may leads. (Reproduced with permission from AL Goldberger et al: Goldberger’s Clinical duction delays in the absence of actual atrial Electrocardiography: A Simplified Approach, 10th ed. Philadelphia, Elsevier, 2024.) more general designation of left atrial — Figure 247-7: Normal electrocardiogram from a healthy male subject showing sinus rhythm, normal PR interval, QRS interval, QT interval, and mean QRS axis.
Figure 8

Caption: FIGURE 247-1 Schematic of the cardiac conduction system. AV, atrioventricular; FIGURE 247-2 Basic ECG waveforms and intervals. Not shown is the RR interval, LA, left atrium; LV, left ventricle; RA, right atrium; RV, right ventricle. the time between consecutive QRS complexes. — Figure 247-8: Right atrial (RA) overload causing tall, peaked P waves and left atrial (LA) abnormality causing broad, often notched P waves in limb leads and biphasic P wave in lead V.
Generated from Harrison's Principles of Internal Medicine, 22nd Edition.